Our latest quarterly update gives an overview of surgical procedure trends across Australia. It covers national private surgery activity alongside state-level dynamics in New South Wales.
1. National Private Surgery Volume Dynamics
Long-term trajectory
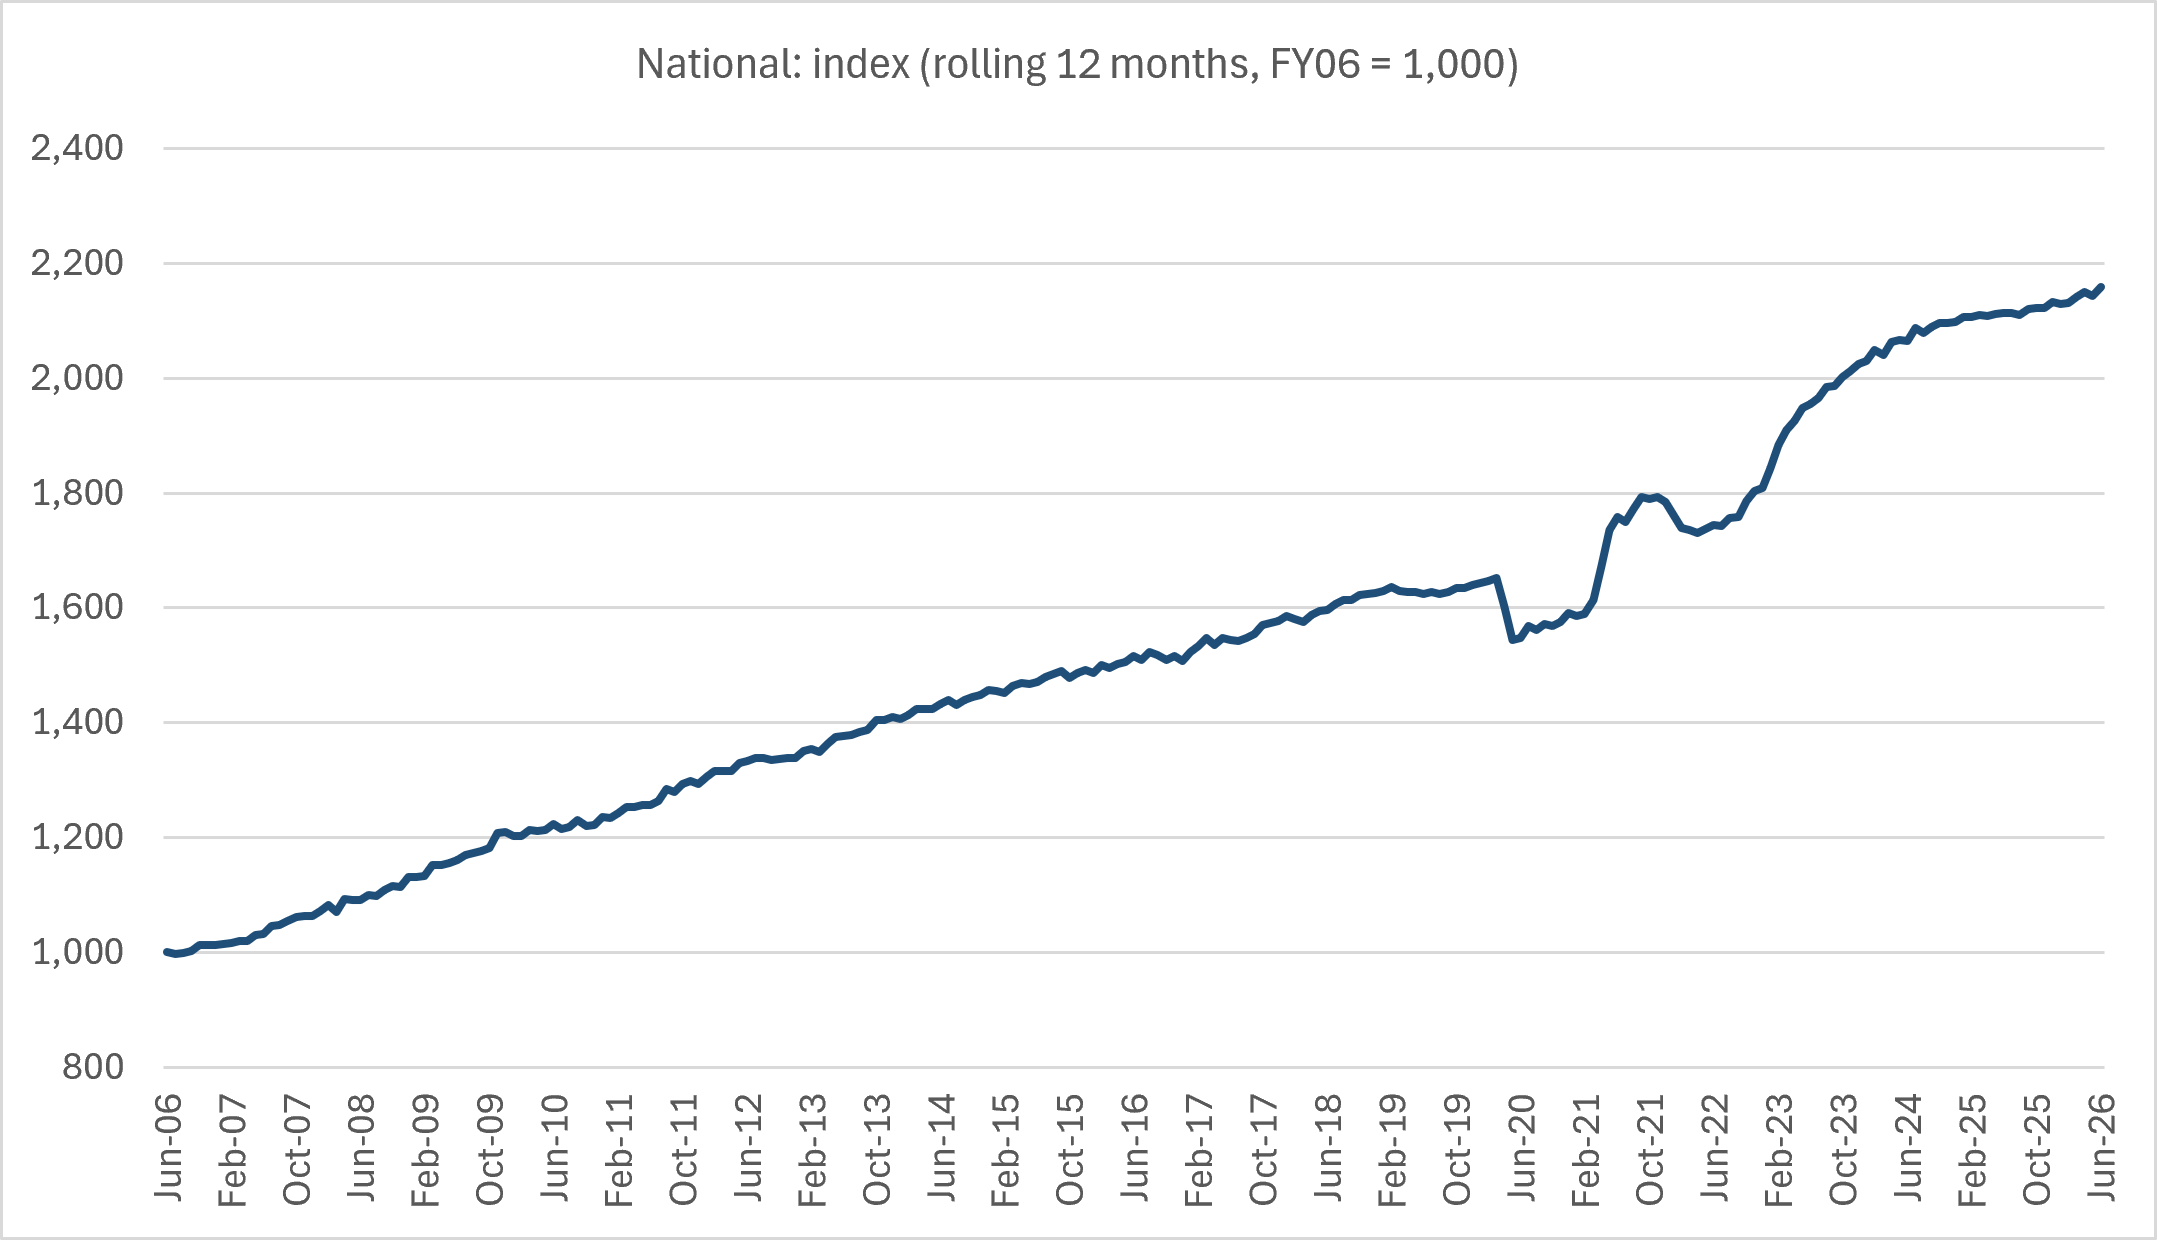
The index has more than doubled over two decades. It has risen from 1,000 in FY06 to 2,158 in June 2026, compounding at nearly 4% a year from 2006 to 2019.
Five-year trend
- Recovery and plateau: volume recovered strongly after 2022, climbing from the ~1,750 range to above 2,050 by mid-2024. It has held a firm upward plateau through mid-2026.
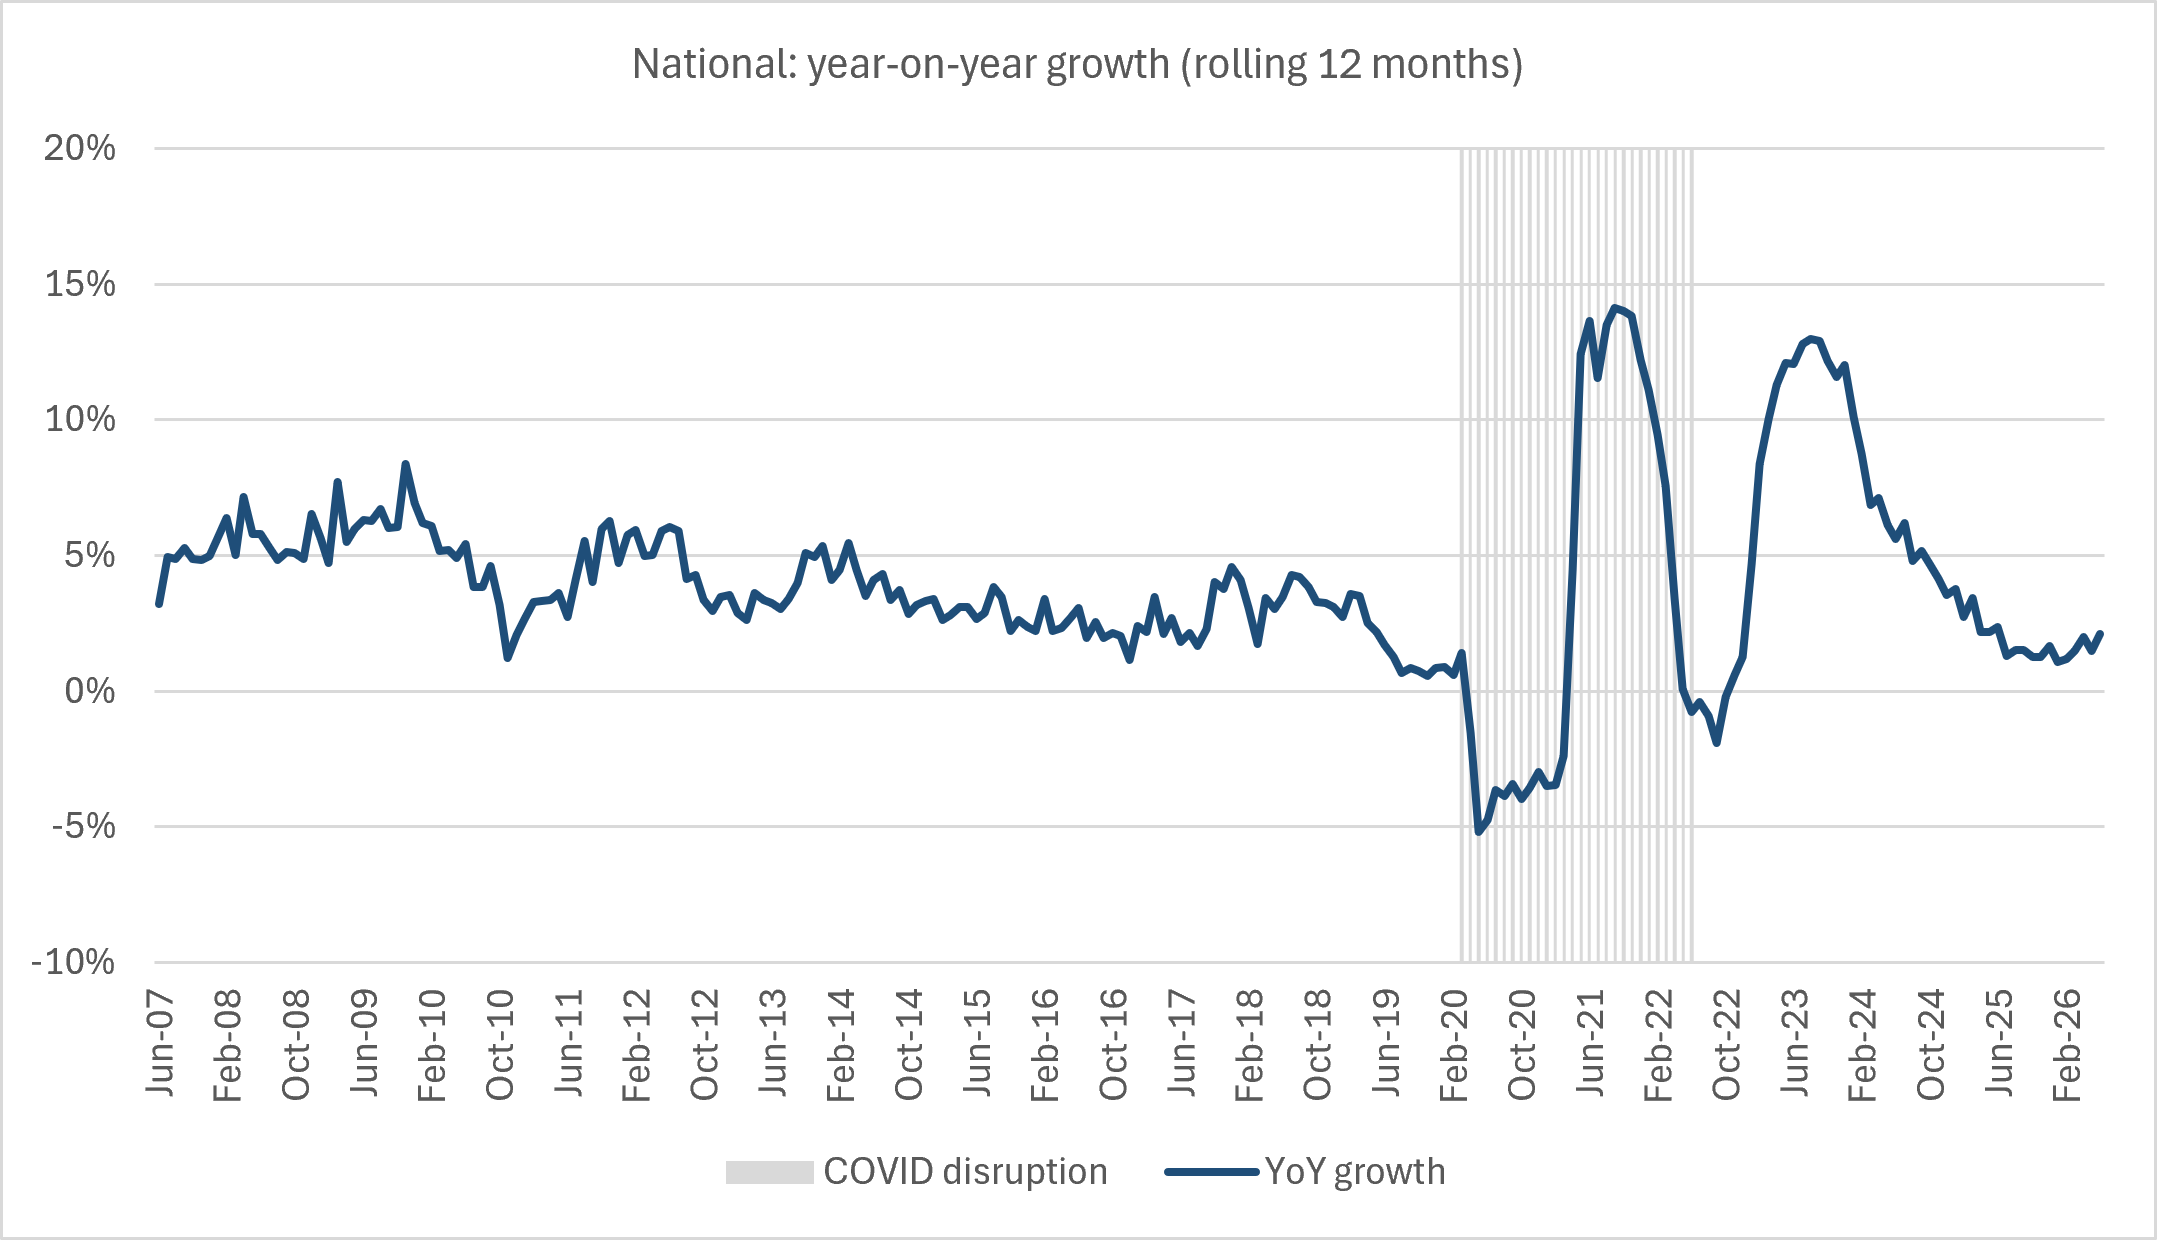
- June: after a small contraction in May, June added 0.7% and set a new all-time high, above April's previous peak of 2,150. Year-on-year growth is 2.1%.
Against the pre-COVID trend
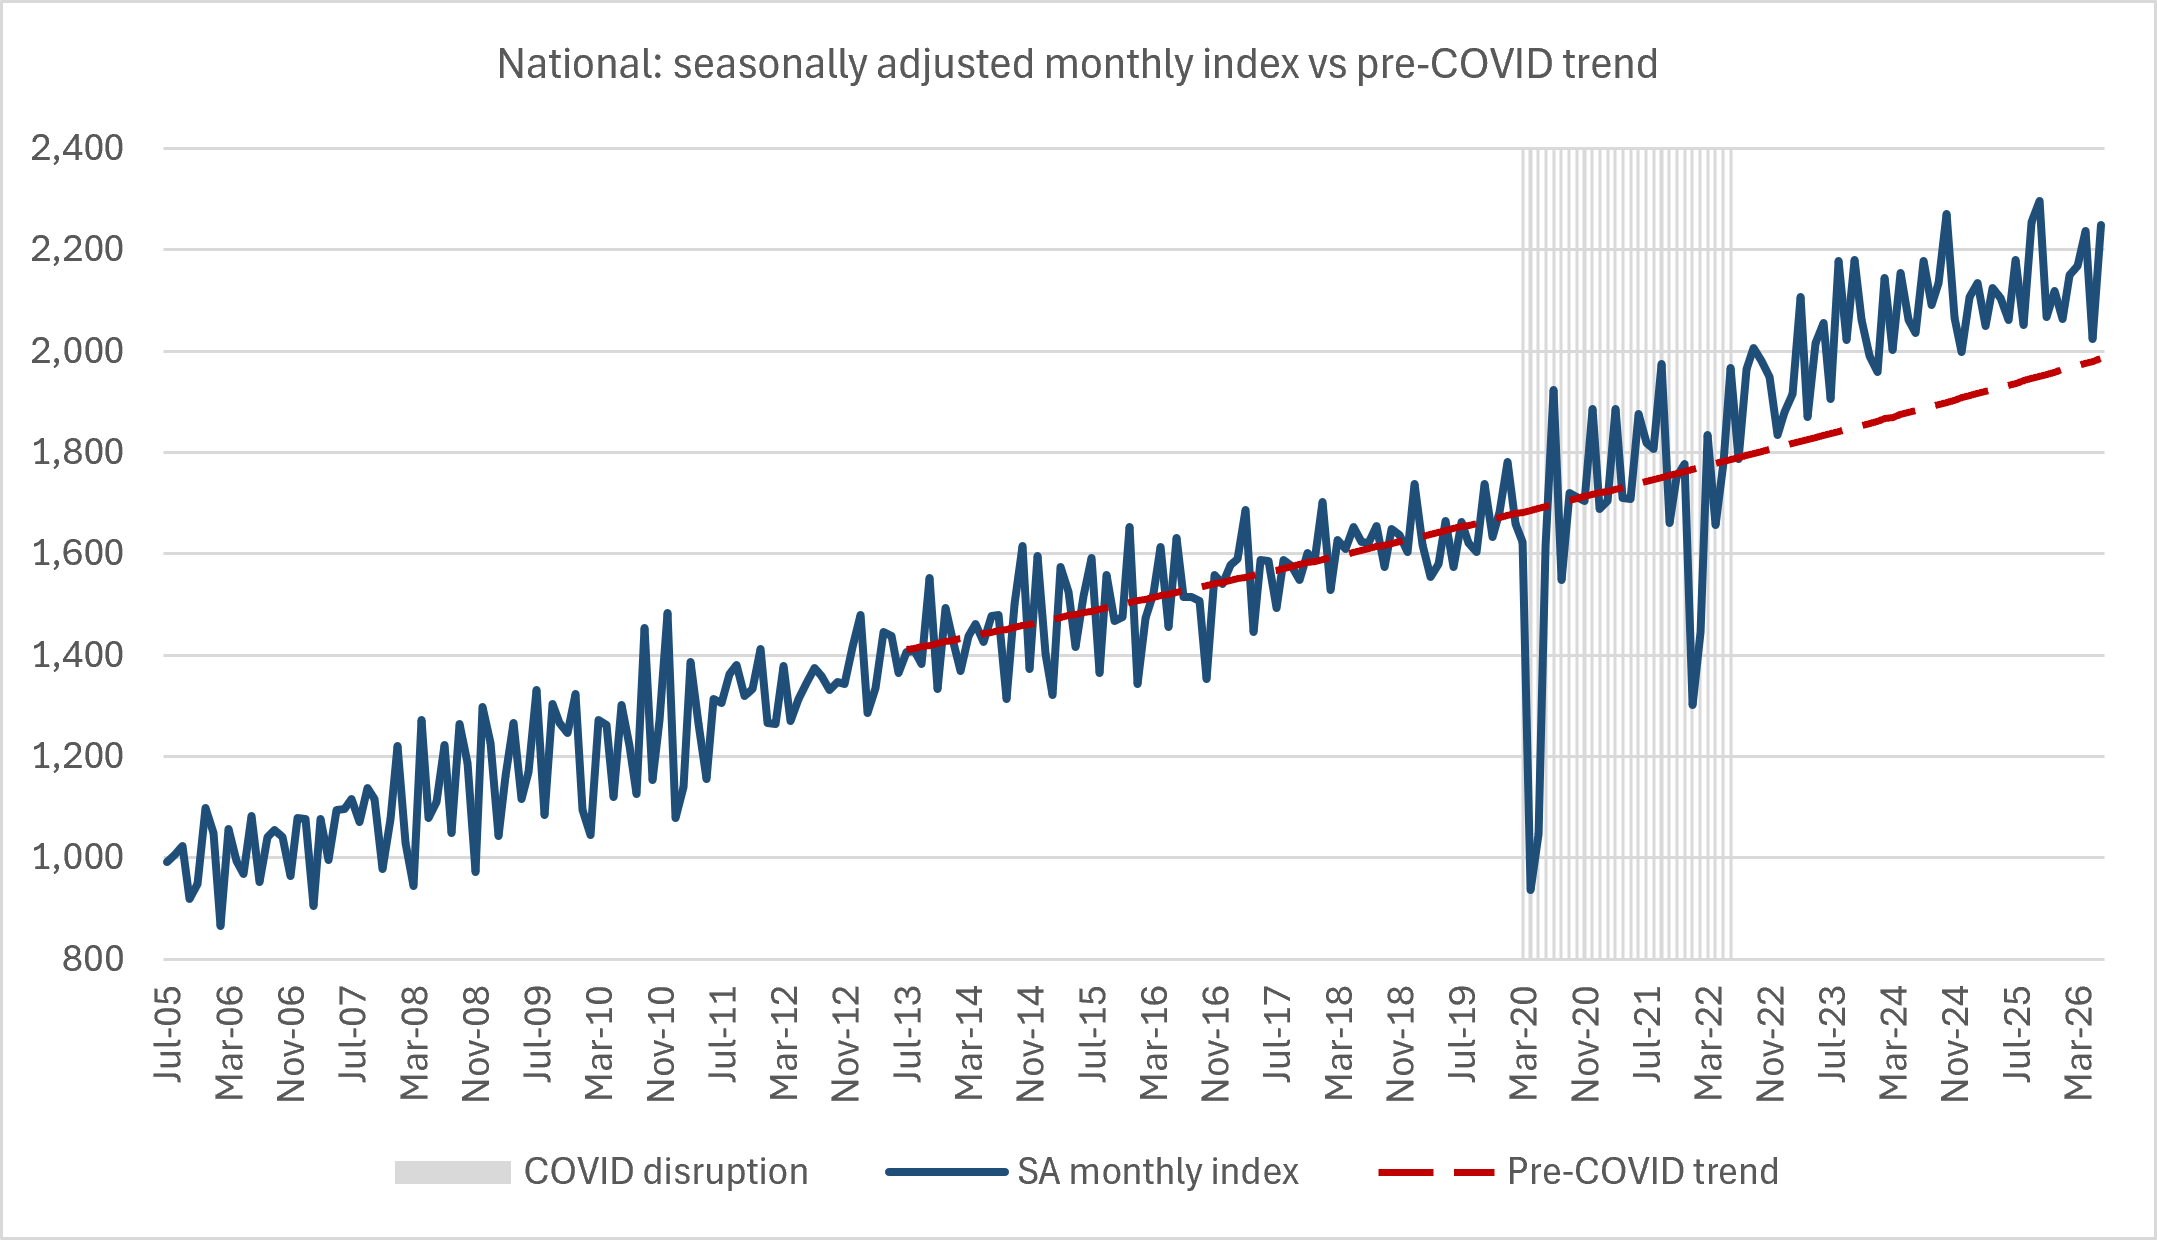
- Gap to trend: on a seasonally adjusted basis, volume over the last three months ran about 10% above where the pre-COVID trend pointed.
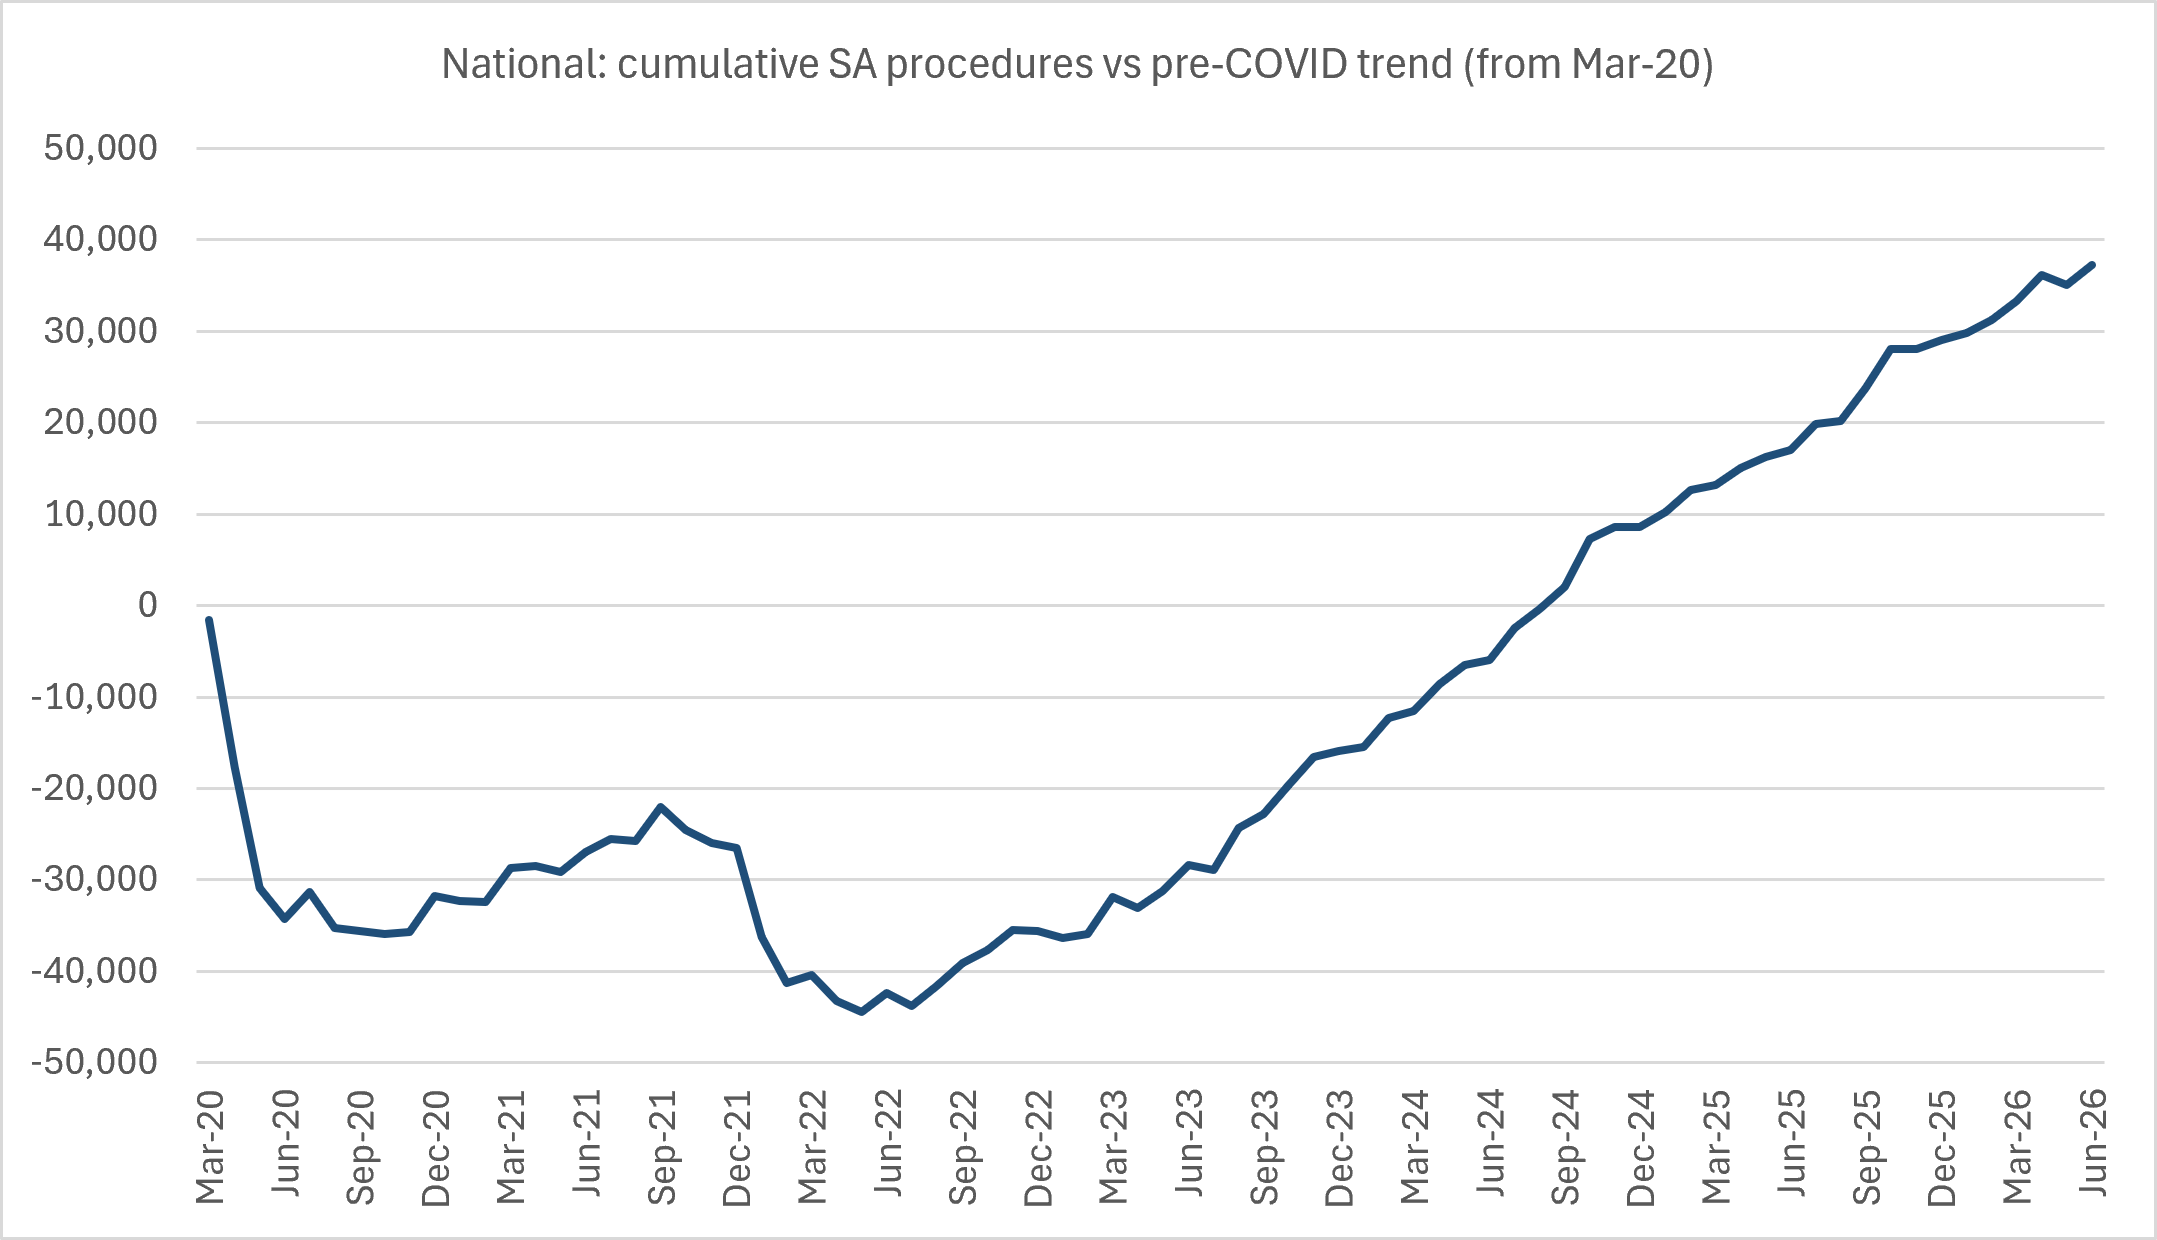
- Lost procedures: the procedures lost in 2020–22 have been fully made up. The sector is now about 37,000 procedures ahead of trend in cumulative terms.
2. NSW Public vs Private Surgical Volumes
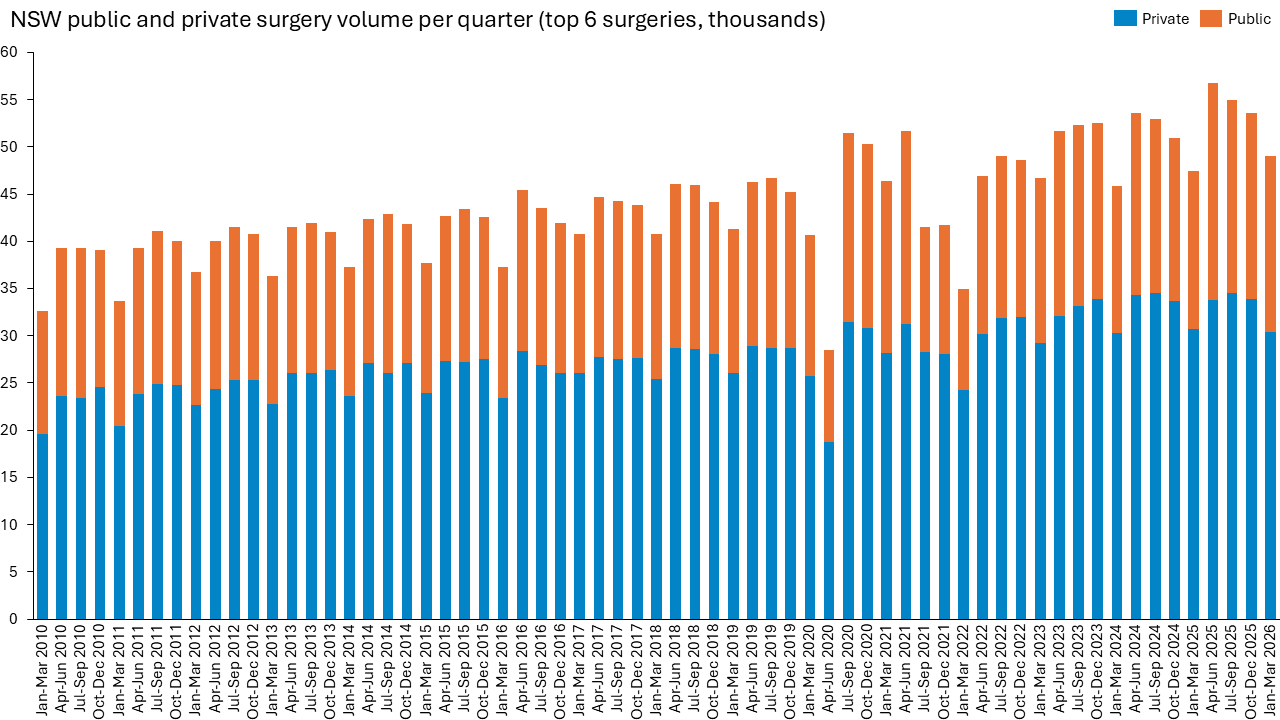
Quarterly Totals: Private procedure volumes remain the primary driver of total throughput in NSW, hovering around the 30,000–35,000 range per quarter in recent periods, while public hospital volumes account for the remaining volume (~15,000–20,000 procedures quarterly).
3. NSW Market Share Trends
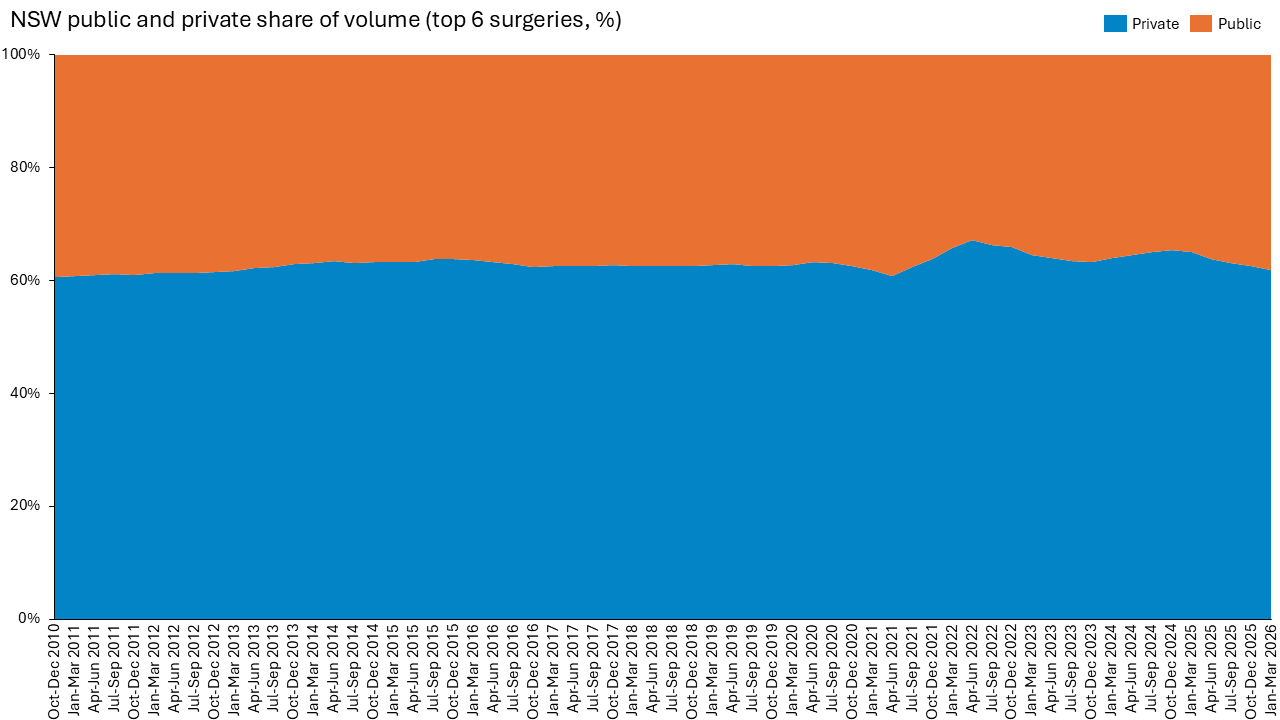
Stable Market Split: Over the long term, private providers consistently account for the majority share of the top 6 surgeries in NSW.
Share Trajectory: The private share of volume expanded from ~60% in 2010 to peak above 65% between 2021 and 2022. Recent quarters through early 2026 show private market share stabilising around the 60%–63% band, with public surgeries representing ~37%–40% of the market.
Next steps
Connect with us to learn how Practice Alliance can help your practice.
Frequently asked questions
What was the Private Surgery Index in June 2026?
The index reached 2,158 in June 2026, a new all-time high. That's up 0.7% on May and 2.1% on June 2025.
How much has private surgery grown in Australia since 2006?
Private surgical volume has more than doubled since FY06. The index has risen from 1,000 to 2,158, and it grew at nearly 4% a year between 2006 and 2019.
Has private surgery recovered from COVID?
Yes. By June 2026, the procedures lost in 2020–22 had been fully made up, and the sector was about 37,000 procedures ahead of its pre-COVID trend.
What share of NSW surgery is done in private hospitals?
For the six procedures tracked, private hospitals perform about 60–63% of procedures in NSW in recent quarters. The private share peaked above 65% in 2021–22.
How many of these procedures do NSW private hospitals perform each quarter?
About 30,000–35,000 a quarter, compared with about 15,000–20,000 in NSW public hospitals.