Our latest data update looks at national private surgical activity through August 2026.
1. Our read of August 2026
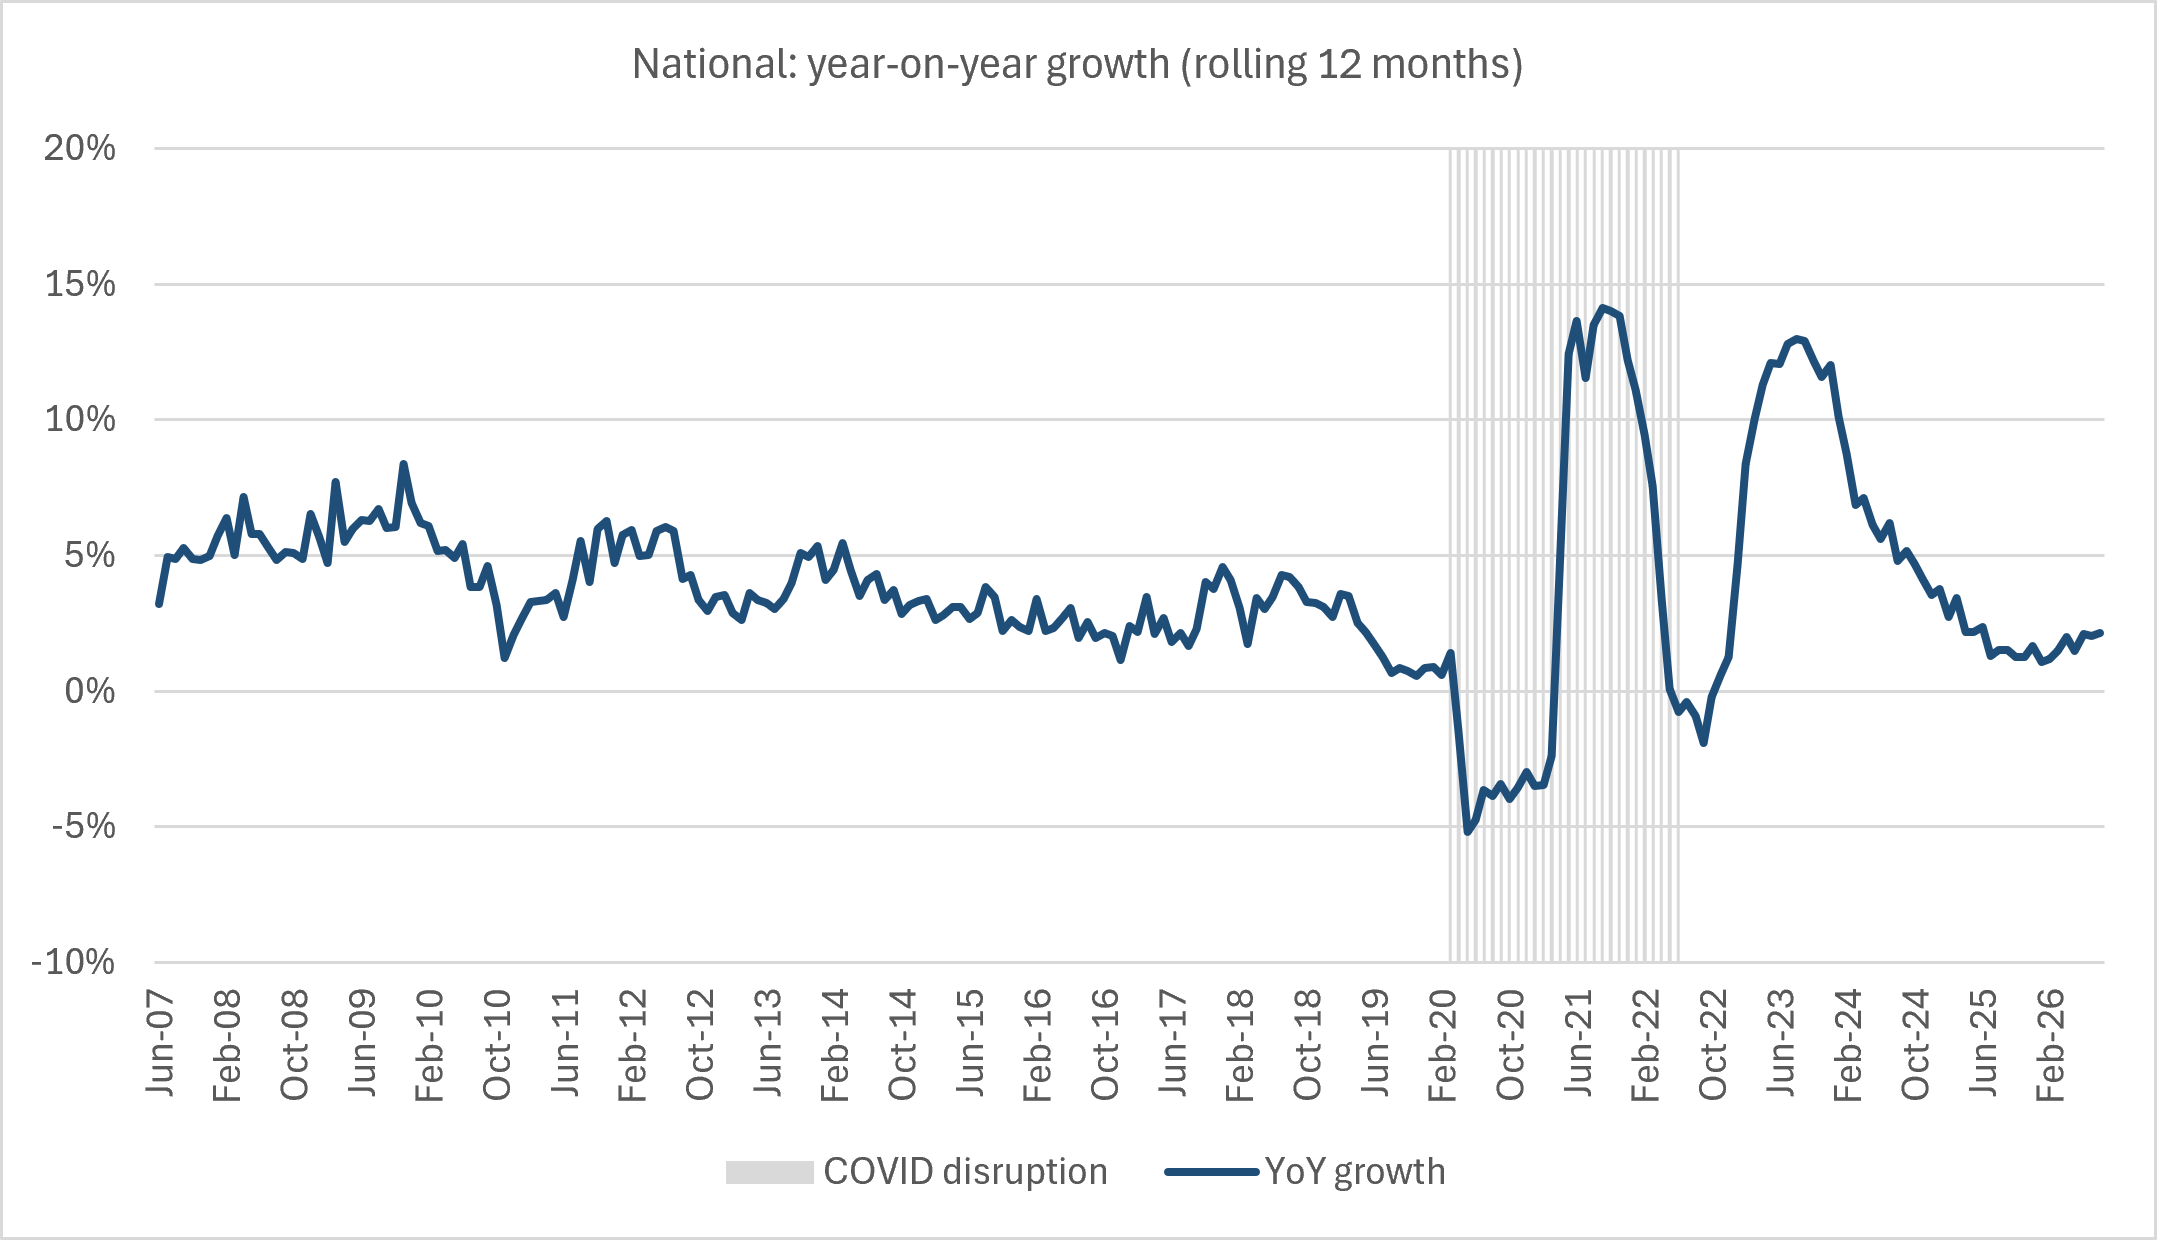
The index was 2,156 in August, down from 2,157 in July. That's a fall of less than 0.1%, and it leaves volume about 2 points below the June high. Year-on-year growth is running at roughly 2%, slightly above the pace we reported last month.
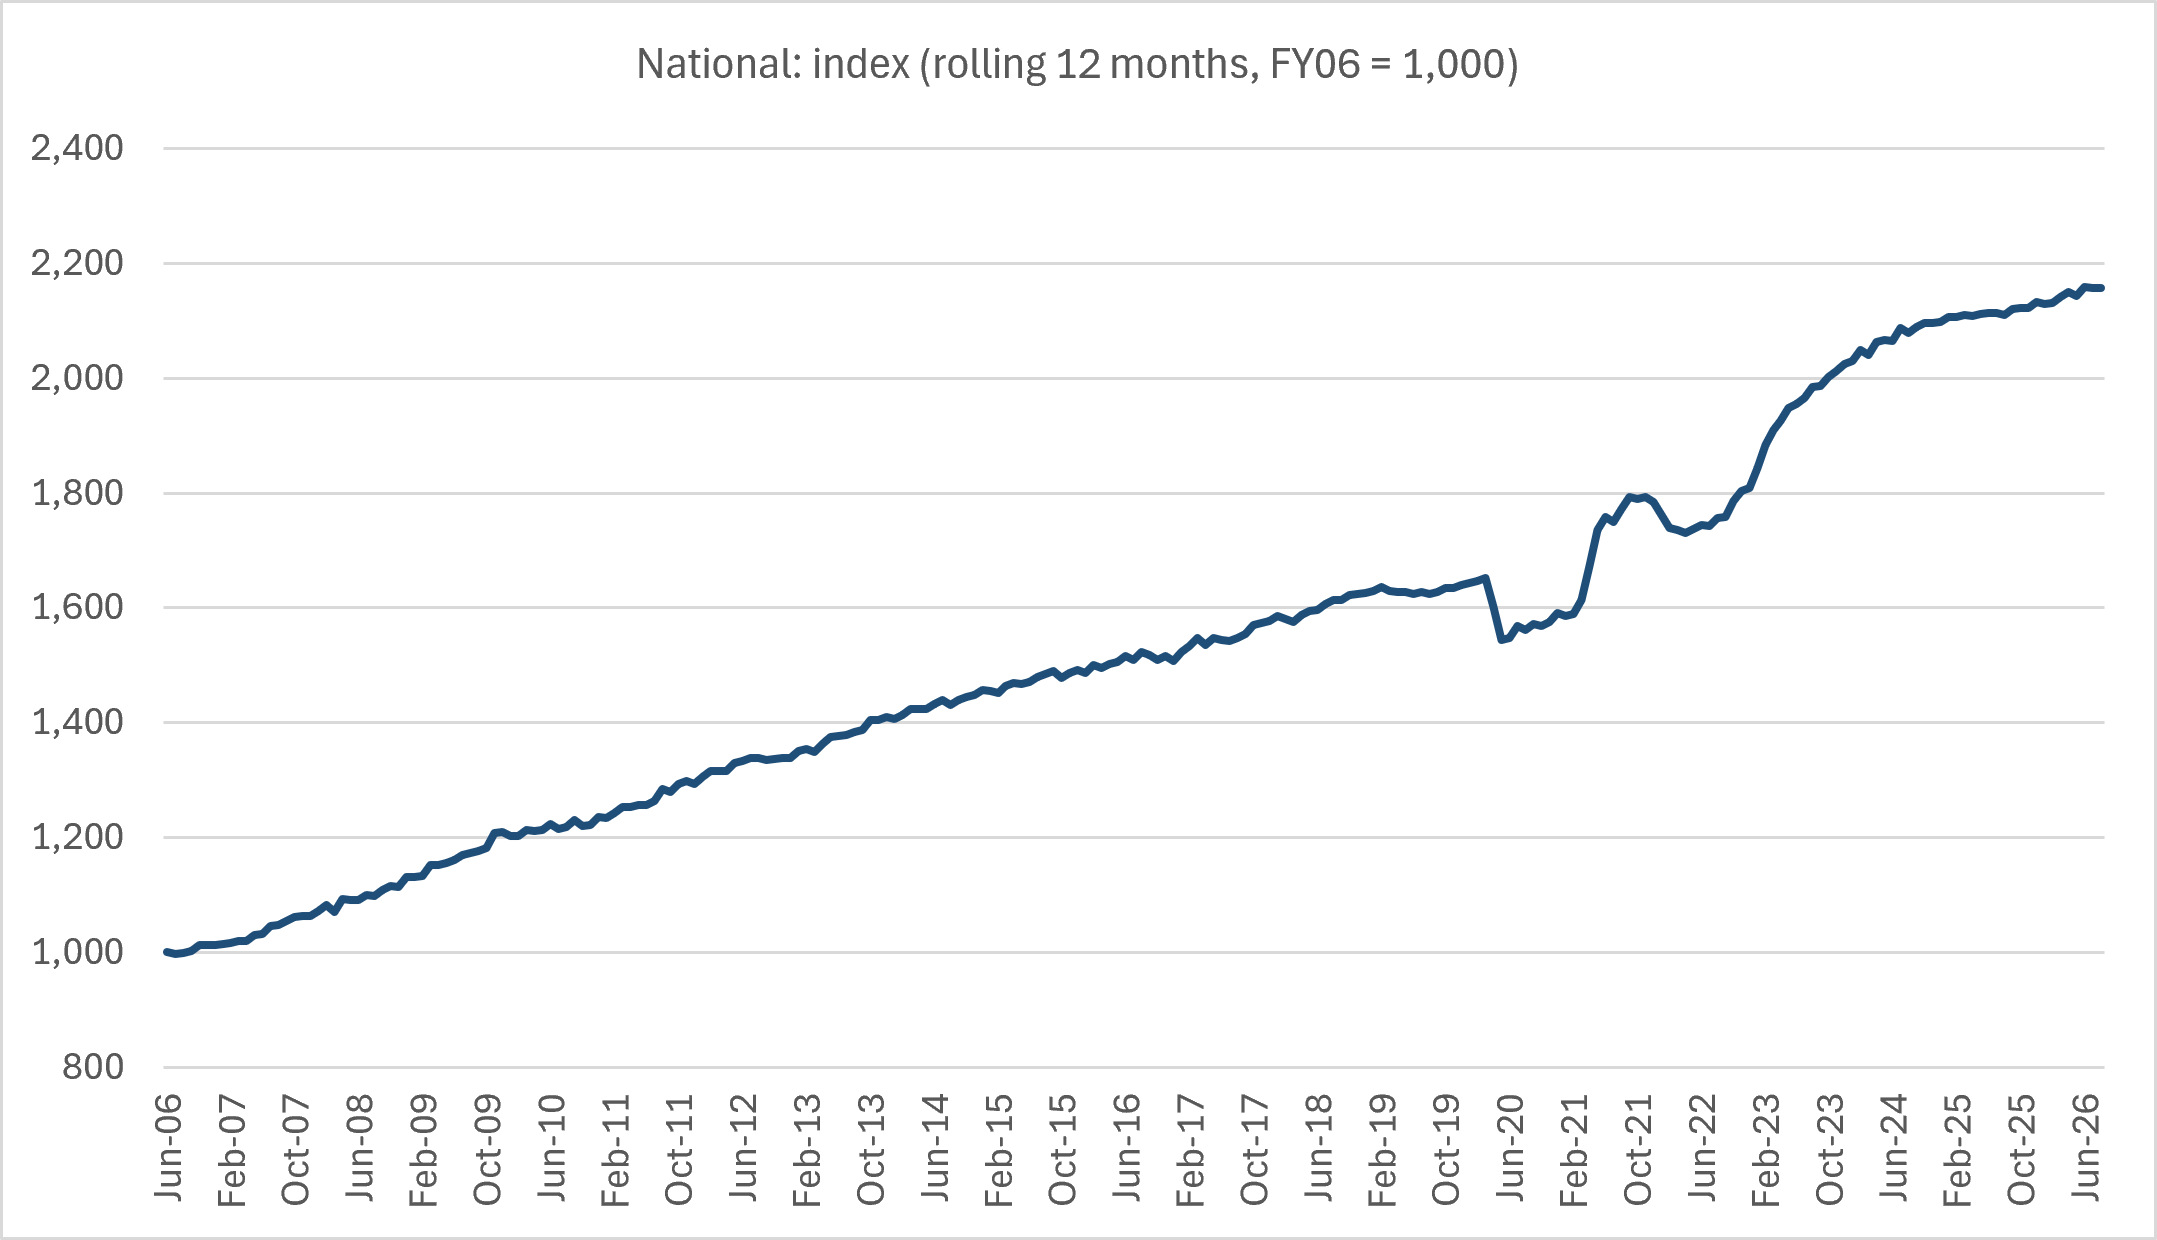
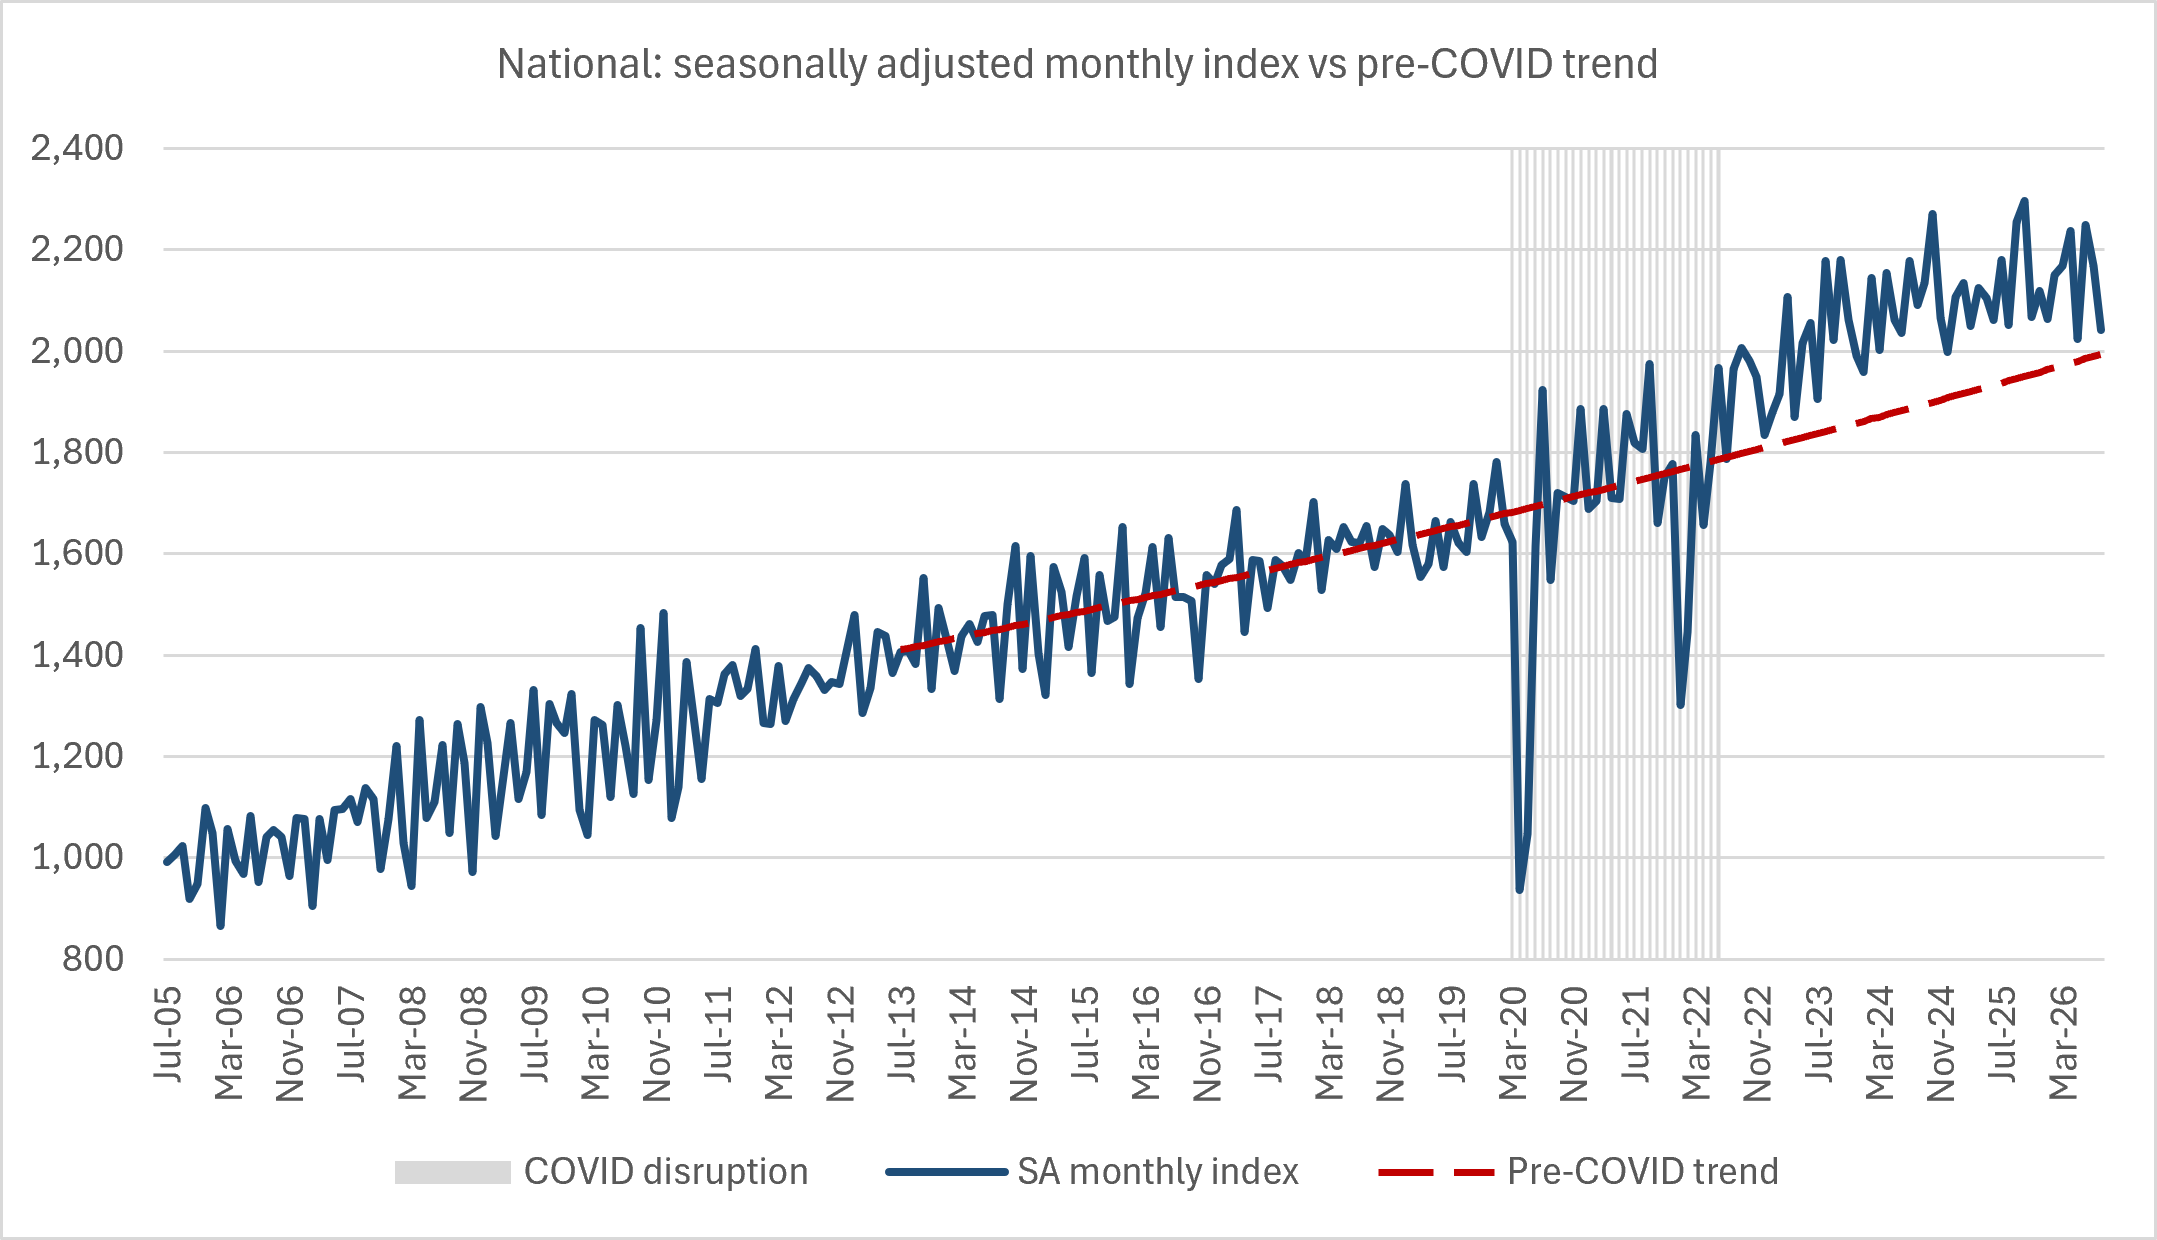
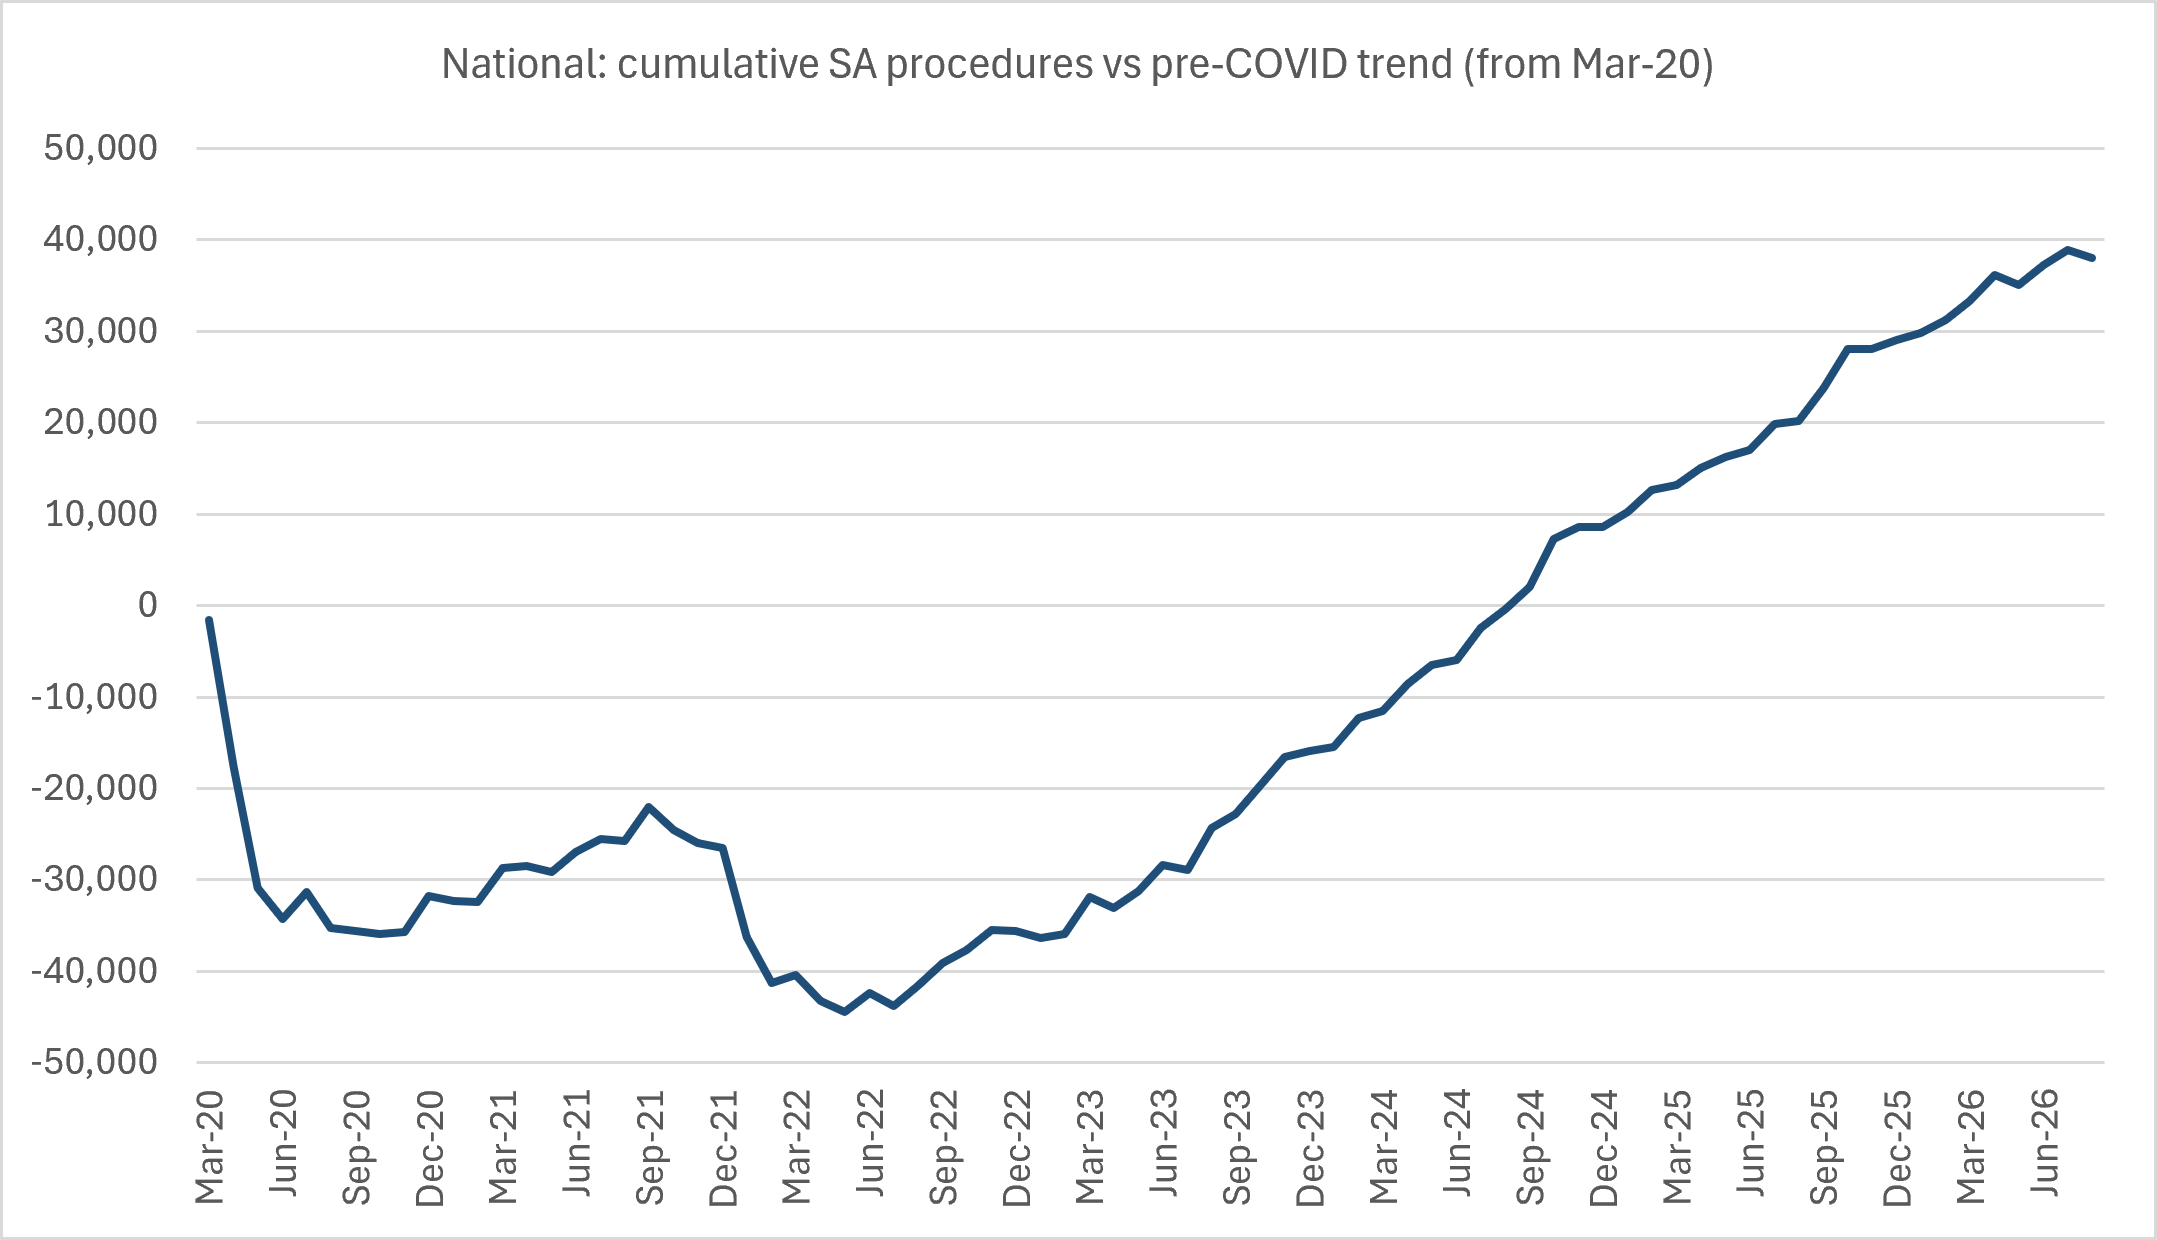
One month is not a trend, and a 1-point move is well within normal monthly noise. August was also soft in both 2024 and 2025, so some of this may be seasonal. Still, the bigger picture is clear: the index has moved sideways in a narrow 2,140–2,160 band since March.
2. What this means for practice owners
Three observations as FY27 gets underway:
- Growth is now below the long-run trend, not just below the post-COVID boom. From 2006 to 2019 the index compounded at nearly 4% a year. Today's growth of roughly 2% is only just over half that. The current plateau is a slowdown against the long-term baseline as well as against the 2022–24 catch-up. Forecasts and valuations should reflect that.
- Don't overreact to a single month, but don't expect a rebound either. August's 1-point dip is within normal noise. The bigger signal is upstream: specialist consultations, the main path into surgery, have been falling for about 18 months. The last time that happened, in 2018–19, the surgery index flattened for about a year. Plan for flat volume through FY27, and treat a sustained fall in specialist consults or the surgery index as the trigger to revisit capacity.
- Fixed costs deserve a fresh look. When volume is flat, every theatre list, session and roster that was sized for growth becomes a cost to carry. Utilisation reviews, session consolidation and smarter scheduling are the quickest ways to protect margin while demand holds steady.
We will keep tracking the index monthly and flag any sustained break from the plateau, in either direction. See our consultation volumes update for the leading indicators behind this trend.
Next steps
Connect with us to learn how Practice Alliance can help your practice.
Frequently asked questions
What was the Private Surgery Index in August 2026?
The index was 2,156 in August 2026, down less than 0.1% on July and about 2 points below June's record.
Is private surgery in Australia plateauing?
Yes. The index has moved sideways in a 2,140–2,160 band since March 2026, with year-on-year growth of about 2%.
How does current growth compare with the long-run trend?
Current growth of about 2% is just over half the long-run pace. Between 2006 and 2019, the index compounded at nearly 4% a year.
Is the August dip seasonal?
Partly, possibly. August was also soft in 2024 and 2025, and a 1-point move is within normal monthly variation.
What is the leading indicator for private surgery volume?
Specialist consultations are the main path into surgery, and they had been falling for about 18 months as of August 2026. The last time this happened, in 2018–19, the surgery index flattened for about a year.